How can I visualize my urban data?
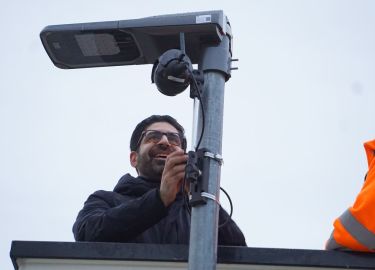
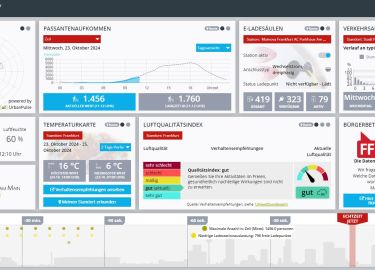
Christopher Bittner from the [ui!] Urban Software Institute explains in a short video how urban data is collected, analysed and prepared for visualization in a [ui!] COCKPIT with the help of the open urban data platform [ui!] UrbanPulse. Using examples, he explains the possible applications and added value that result from the use of visualization for citizens, but also for municipal decision-makers. See for yourself...


