
")

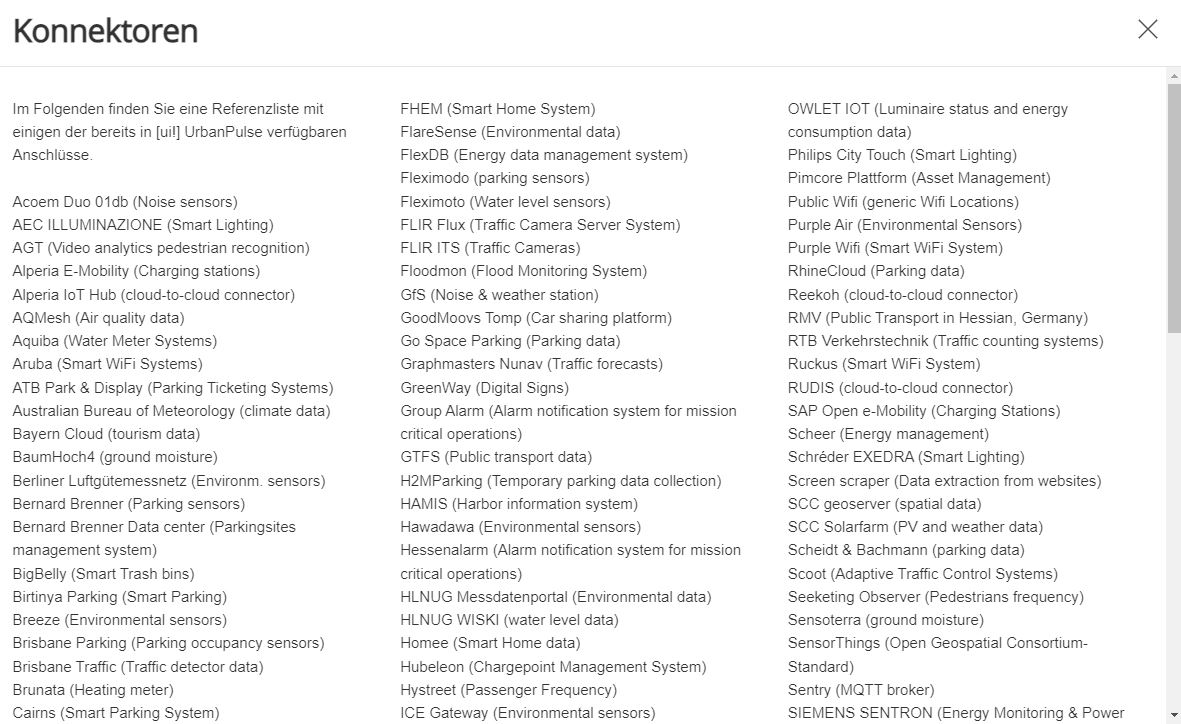
Below you will find a reference list of some of the connections already available in [ui!] UrbanPulse.
Acoem Duo 01db (Noise sensors)
AEC ILLUMINAZIONE (Smart Lighting)
AGT (Video analytics pedestrian recognition)
Alperia E-Mobility (Charging stations)
Alperia IoT Hub (cloud-to-cloud connector)
AQMesh (Air quality data)
Aquiba (Water Meter Systems)
Aruba (Smart WiFi Systems)
ATB Park & Display (Parking Ticketing Systems)
Australian Bureau of Meteorology (climate data)
Bayern Cloud (tourism data)
BaumHoch4 (ground moisture)
Berliner Luftgütemessnetz (Environm. sensors)
Bernard Brenner (Parking sensors)
Bernard Brenner Data center (Parkingsites management system)
BigBelly (Smart Trash bins)
Birtinya Parking (Smart Parking)
Breeze (Environmental sensors)
Brisbane Parking (Parking occupancy sensors)
Brisbane Traffic (Traffic detector data)
Brunata (Heating meter)
Cairns (Smart Parking System)
Cambio (Car sharing platform)
Casambi (Smart Lighting)
Chargecloud (Charging stations)
ChargeIt (Charging data)
ChargePointOperator (OCPI Charging data)
Cisco Meraki (Smart WiFi Systems)
Civento (Construction Sites)
Clean City Networks (Waste bin data)
Cleverciti OffStreet (Parking Management)
Cleverciti OnStreet (Parking Management)
Cleverciti Ticks (Parking Management)
Cologne Parking (Parking garages data)
Cologne Traffic (Traffic flow data, Traffic Obstructions)
Comark Laser Scanner (Bike detection sensors)
Connctd IoT (Smart Home System)
Continental Carsharing (Car sharing platform)
Corona Incidence Report (COVID-19 Situation)
Count and Care (MQTT connector)
Crossfleet (Car sharing platform)
CSV Data (generic data import)
Datex II (traffic data)
DB ParkSpace (Parking Data)
DB Flinkster (Car Sharing)
DB Call a Bike (Bike Sharing
DEFAS (Public Transport data)
DFKI onboard Unit (Car Telemetry Interface)
Discovergy (Smart Meter data)
Duo Smart Noise (Noise sensors)
Eco-counter (Traffic count data)
e-sensio urban SmartBox (Environmental Sensors)
EarthSense (Air Quality)
EDIFACT MSCONS (Energy Data)
Eluminocity (Charging data)
Emio (Environmental sensors)
EnBW Sm!ght (Smart lamp post, Environmental Sensing & EV Charger)
Enevo (Waste bin data)
e-netz InfoMap (Construction Sites)
Entega (Energy Distribution Grid)
Feratel (Event Calendar)
FHEM (Smart Home System)
FlareSense (Environmental data)
FlexDB (Energy data management system)
Fleximodo (parking sensors)
Fleximoto (Water level sensors)
FLIR Flux (Traffic Camera Server System)
FLIR ITS (Traffic Cameras)
Floodmon (Flood Monitoring System)
GfS (Noise & weather station)
GoodMoovs Tomp (Car sharing platform)
Go Space Parking (Parking data)
Graphmasters Nunav (Traffic forecasts)
GreenWay (Digital Signs)
Group Alarm (Alarm notification system for mission critical operations)
GTFS (Public transport data)
H2MParking (Temporary parking data collection)
HAMIS (Harbor information system)
Hawadawa (Environmental sensors)
Hessenalarm (Alarm notification system for mission critical operations)
HLNUG Messdatenportal (Environmental data)
HLNUG WISKI (water level data)
Homee (Smart Home data)
Hubeleon (Chargepoint Management System)
Hystreet (Passenger Frequency)
ICE Gateway (Environmental sensors)
INCOTEC (Passenger Frequency)
INRIX (Parking data)
Intelliport IPS-403 NB-IoT (Traffic Sensor)
JSON Schema (generic data import)
KairosDB (Timeseries Database Connector)
Kerlink LoRa IoT Station (LoRaWAN Gateway)
Kimley Horn KITS (Traffic data)
Klimaherzen (CO2-Savings Incentive system)
KNX (Building Management System)
KVB (Public transport station data)
LanUV (NRW environment data)
Las Vegas Traffic (Traffic detector & signal state data)
Libelium Plug&Sense Smart City (Sensor devices)
Libelium Plug&Sense Smart Environment (Sensor devices)
Libelium Plug&Sense Smart Environment Pro (Sensor devices)
LuenNi (Niedersachsen environment data)
manageE (per second energy meter)
Marine traffic (Ship monitoring system)
MDM (moblity data marketplace)
Mobileeee (e-Carsharing data)
Modality (Container management system)
Modbus (Building Management System)
MOL BuBi (Hungarian bike sharing platform)
MQTT (generic MQTT Receiver)
Mr. Fill (Smart Trash bins)
Munisense (Noise sensors)
Netatmo (Environmental Sensors)
nextbike (Bike sharing platform)
Node Red (Data flow system)
NXP (RFID tag data)
NYC Traffic (Traffic detector & signal state data)
OCIT-C (Standard for Traffic Management Systems)
OCPI Last Mile Solutions (EV charging)
Olbring (water level sensors)
One M2M (cloud-to-cloud connector)
OpenWeatherMap (Weather data)
OWLET Nightshift (Luminaire status and energy consumption data)
OWLET IOT (Luminaire status and energy consumption data)
Philips City Touch (Smart Lighting)
Pimcore Plattform (Asset Management)
Public Wifi (generic Wifi Locations)
Purple Air (Environmental Sensors)
Purple Wifi (Smart WiFi System)
RhineCloud (Parking data)
Reekoh (cloud-to-cloud connector)
RMV (Public Transport in Hessian, Germany)
RTB Verkehrstechnik (Traffic counting systems)
Ruckus (Smart WiFi System)
RUDIS (cloud-to-cloud connector)
SAP Open e-Mobility (Charging Stations)
Scheer (Energy management)
Schréder EXEDRA (Smart Lighting)
Screen scraper (Data extraction from websites)
SCC geoserver (spatial data)
SCC Solarfarm (PV and weather data)
Scheidt & Bachmann (parking data)
Scoot (Adaptive Traffic Control Systems)
Seeketing Observer (Pedestrians frequency)
Sensoterra (ground moisture)
SensorThings (Open Geospatial Consortium-Standard)
Sentry (MQTT broker)
SIEMENS SENTRON (Energy Monitoring & Power Distribution)
SIEMENS (Traffic Management Systems)
Smart City Systems (Parking Data)
Smart Link (Irrigation data)
Spot (Environmental Sensors)
SPP Analytics (Signal Phase Timings)
Stadtwerke Aalen (Parking management)
Sustainder Brokerage (Smart Lighting)
SWARCO KR (Traffic Management System)
SWARCO TMS (Traffic Management System)
Swisstraffic (Traffic detector data)
Tier Mobility (Scooter Sharing)
Tom Tom (Traffic data)
Translink (Public transport data)
Tüga Plusportal (Smart Wifi System)
TVILIGHT (Smart Lighting)
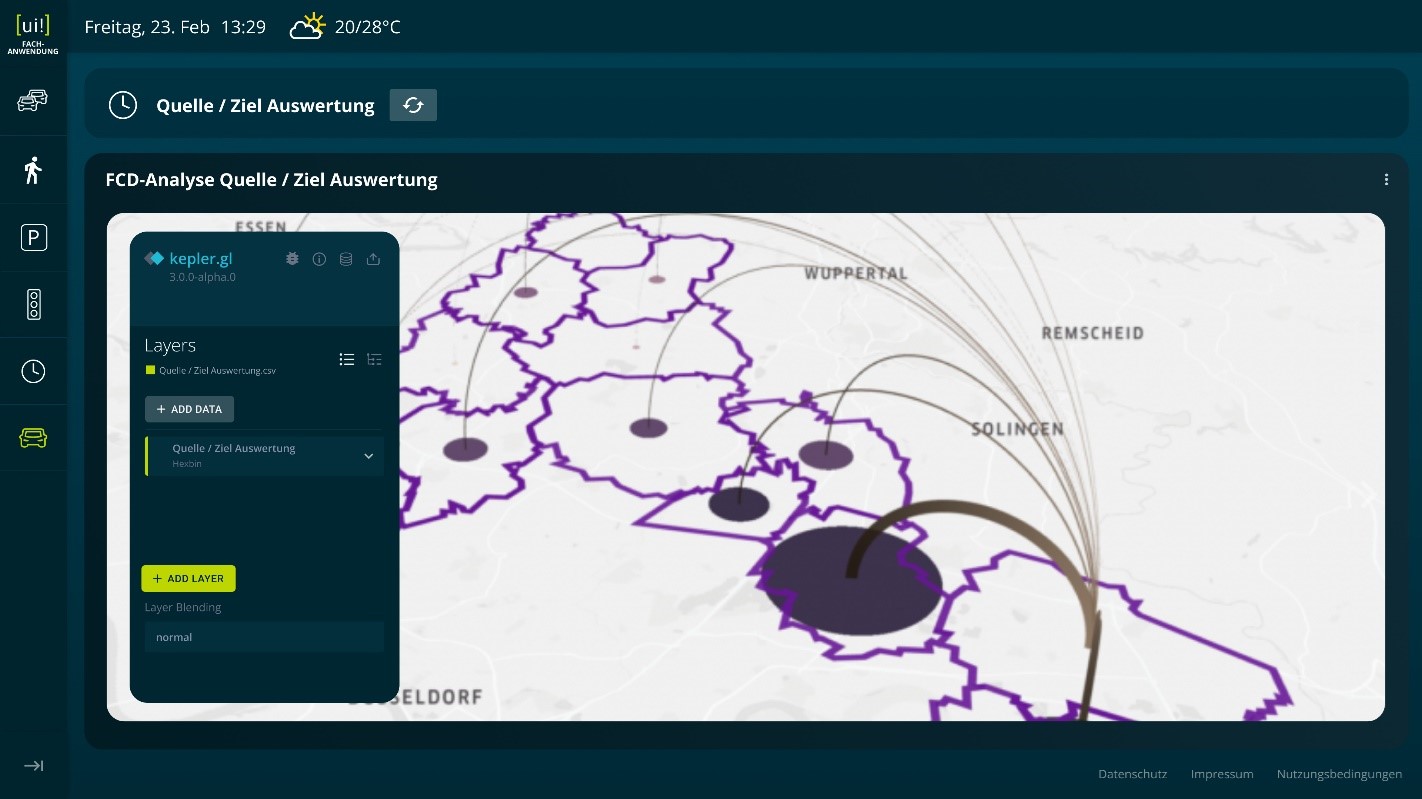
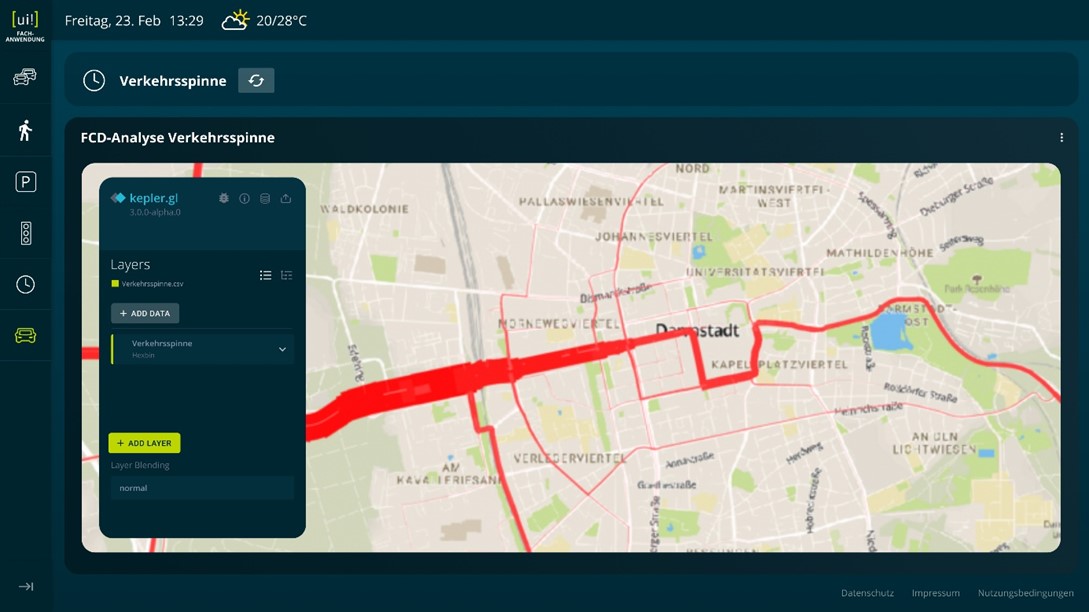
[ui!] TRAFFIC (inner City traffic density)
Vaisala (Environment – receives pushed data)
Vaisala beacon cloud (Environment sensors)
Vaisala Mobile Detector (road conditions)
Vaisala WX Horizon (road conditions)
Vaisala Xweather (Environment sensors)
VDH (Traffic counting & video)
Vivacity Labs Tracks (Traffic management)
Vivacity Labs V2 (Traffic management)
Vivarium (Smart Zoo)
Viom Floating Car Data (FCD)
WaveScape (Crowd based sound measurement platform)
Wikidata (City Info)
Wordpress (Newsfeed)
YellowMap (Charging stations in Germany)
Ymatron (Waste bin data)
Zenner ElementIoT (LoRaWAN network server)
Zendesk (Ticketing system)
Zeta (Charging controller)
ZTIX (Event Calendar)
Further connectors are currently under development...
[ui!] TRAFFIC
Smart traffic optimisation for your municipality


: Verlustzeit")
